Your first session
What a Claude Code session looks like, what the prompts mean, and how to run the demo benches end to end.
Starting Claude Code
Run claude from inside the directory you want to work on. The agent treats
that directory as the project: it reads the RTL there, and writes its
testplans, checkers and results there.
ssh -i your-key.pem ubuntu@your-instance.singularity.voltai.ai
cd ~/caliptra-demo
tmux
claude
The header confirms what you are running against — the model, and that the key is billed to Voltai's API account, not to you.
Two prompts you will see
"Do you trust this folder?"
The first time you open a directory, Claude Code asks whether it may read, edit and execute files there. Pick Yes, I trust this folder. It remembers the answer per directory.
Tool approval
Before running a shell command or editing a file, the agent shows you exactly what it is about to do and waits:
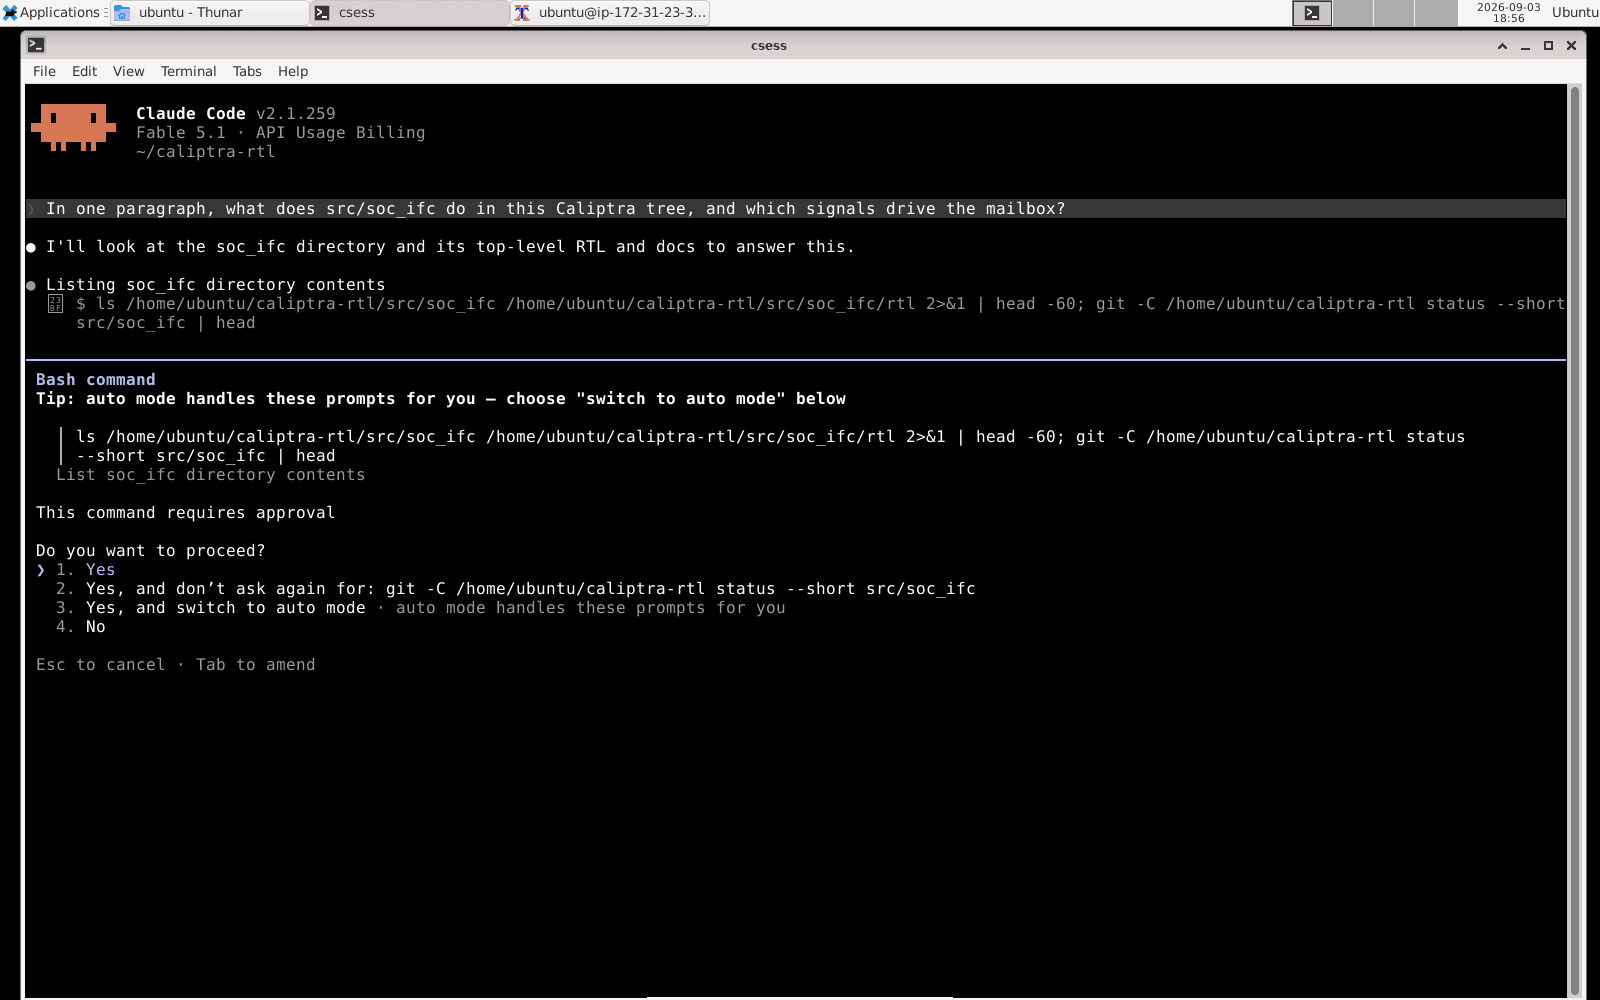
- Yes — run this one.
- Yes, and don't ask again for … — allow that specific command pattern for the rest of the session.
- Yes, and switch to auto mode — stop asking for the session. Fine once you have seen a few and trust the flow; every action is still shown, just not gated.
- No — skip it and tell the agent what to do instead.
This is the agent's safety model: it never runs anything on your design you have not seen. Long formal runs go through the same gate, so if you step away, check that you are not blocking on an approval.
Reading an answer
Ask a question first — it is the fastest way to learn the shape of what comes back:
In one paragraph, what does
config_rtl/mbox_arbcheck, and which RTL files and directives does it read?
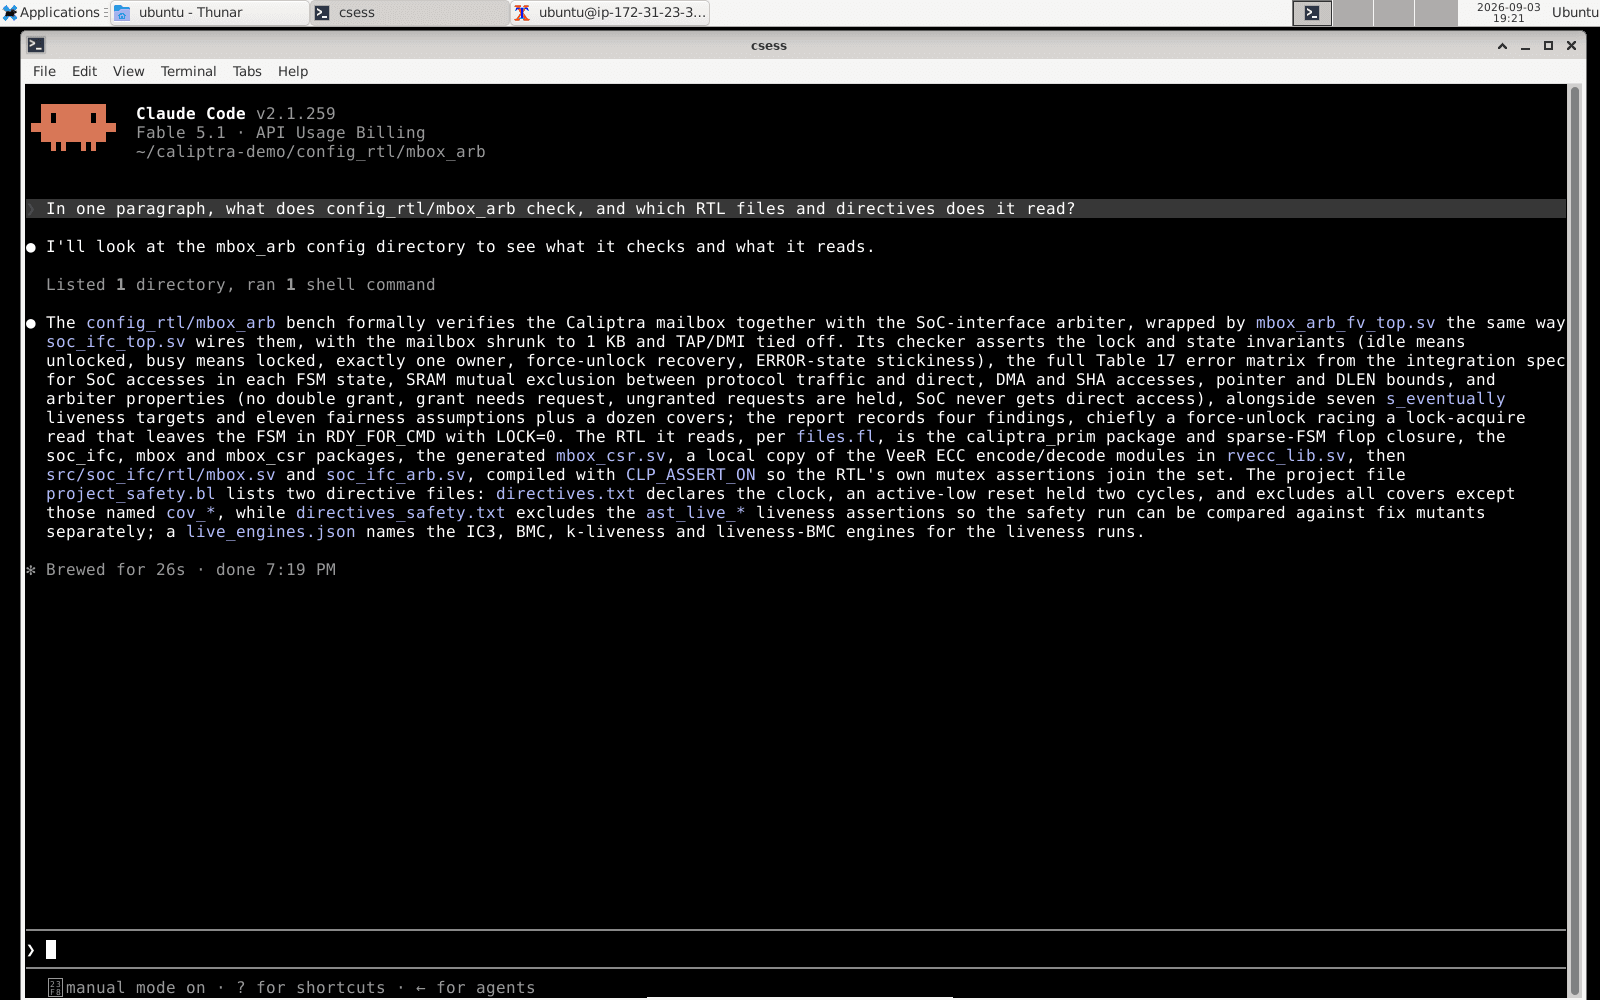
Notice what it did: it listed the bench directory, read files.fl,
directives.txt, directives_safety.txt, live_engines.json and the
checker, and answered with the actual property classes and file names —
lock and state invariants, the Table 17 error matrix, SRAM mutual exclusion,
the s_eventually liveness targets — not from a general description of
Caliptra. That grounding in your files is what makes the rest of the workflow
trustworthy.
Running a bench
Each demo bench is a normal Bitlevel project, so this is exactly what running your own block looks like. Name the bench, and state a time budget — that is more effective than asking for a depth:
Run the
mbox_arbsafety bench (project_safety.bl) with an 8 minute timeout and 3 workers, then triage everything that fired.
What happens, roughly in order:
- Compile.
bitlevel-compile project_safety.blbuilds the model from the file list. A handful ofVERI-*warnings are expected on shipped RTL and the bench README lists them. - Analyze.
bitlevel-analyze .bitlevel_cache --results-dir out_safety/ --timeout 8m --workers 3runs the engines in concert. - Report.
out_safety/summary.txthas verdicts by class,results.jsonhas every property with its verdict, depth and engine, andreduced/deltas/<property>.deltahas the minimal counterexample for anything that fired. The agent reads these and gives you a triaged list: real design bugs, checker bugs, environment artifacts — each bounded result carrying the depth it reached.
Then interrogate the result:
Explain the first counterexample cycle by cycle. Is the force-unlock race a real hardware bug or a missing assumption?
Which of the assumptions in
REPORT.mdare firmware discipline rather than hardware facts? Would the finding survive without them?
The other two benches work the same way. pv takes about fifteen minutes.
dma_ctrl has two projects — project_nodisc.bl is a safety run; project.bl
is a liveness run that needs the live_engines.json orchestrator and four
workers, and the agent knows to add them. config_rtl/run_all.sh runs all
four in sequence if you would rather script it.
Judge first, then check
docs/EXPECTED_RESULTS.md lists the expected verdicts, failing properties
and traces. It is kept out of the bench directories on purpose: run a bench,
form your own view of the counterexamples with the agent, and only then
compare.
When something fails
A failing check is the most useful thing Bitlevel produces: a concrete, minimal
counterexample that says precisely how the design violates its spec. Ask the
agent to explain it and it walks the trace cycle by cycle. To look yourself,
the VCD is under out_safety/vcds/ and the plain-text .delta next to it
lists every value change — x marks a don't-care.
Connecting covers the viewers.
Session hygiene
- One run per directory. Never start two
bitlevel-compile/bitlevel-analyzeinvocations in the same bench at once; they share a cache. - Recompile after any RTL or directives change —
analyzenever re-reads the Verilog. The agent does this for you; just know why it is re-compiling. - Never
rm -rf .bitlevel_cache/by hand. Re-runningbitlevel-compileis the way to get a fresh cache. - Resume, don't restart. A run that ended with properties
PENDINGorBOUNDED_PASSpicks up where it left off if you repeat the samebitlevel-analyzecommand; recorded verdicts are kept. - Use threads as your record:
claude --resumereturns to a previous session, with everything the agent did and found.